The Chip Counts Its Own Stalling
The Chip Counts Its Own Stalling
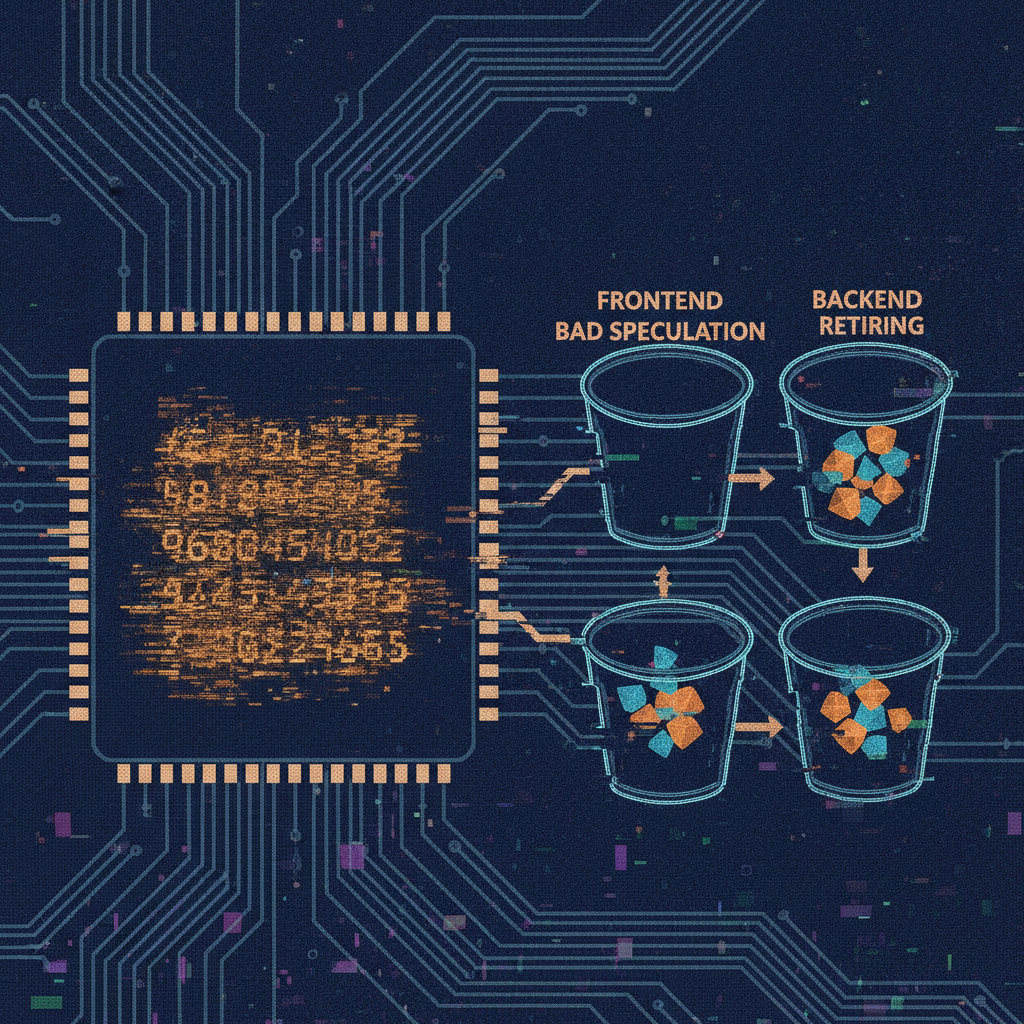
A profiler used to mean inserting timers and hoping the overhead didn't lie. The performance monitoring unit removes the hoping: it is silent hardware sitting beside the pipeline, incrementing counters for events the software never asked for and never sees until it reads them back — every retired instruction, every cache miss, every mispredicted branch, counted as it happens, at the speed the pipeline itself runs.
Top-Down analysis takes those raw counts and forces them into a strict accounting. Every cycle in the chip's history that shift belongs to exactly one of four categories — frontend bound, bad speculation, backend bound, retiring — no cycle left unclaimed, no ambiguity about where the time went. A program is not "slow" in the abstract; it is 40% backend-bound waiting on a cache line, or 15% wasted on a branch that guessed wrong and had to unwind.
Precise Event-Based Sampling closes the last gap. Instead of a percentage attached to a category, it attaches an exact instruction pointer to the moment a counter overflowed, so the accounting names not just a fraction of the chip's time but a specific line of code that spent it. "Why is this slow" stops being a guess and becomes an arithmetic partition of every cycle spent, traceable back to the instruction that spent it.
Seed: Hardware Performance Monitoring & Top-Down Microarchitectural Analysis (PMU, TMAM, PEBS).